Typatone: Statistical Analysis
Published July 19, 2016 by Jono Brandel with data updated every 15th of the month.
When Lullatone and jonobr1 published their first collaborative work, an audio-visual instrument Patatap (2014), they anticipated a niche reception. The Internet has a way of shining unexpected spotlights and transforming nascent ambitions into vast and viral experiences. Two years after release, Patatap has garnered more attention than the artists could have imagined. Despite broad lauding and popularity, Patatap found itself as the saccharine centerpiece for articles like Refinery 29’s Prepare To Spend Way Too Much Time With Patatap. The complex work which occupied the artists for years, was now labeled the nexus of procrastination.
 Patatap, 2014. Animated Gif Capture.
As Lullatone and jonobr1 set out on their latest collaboration, Typatone (2015) a text editor that creates audio accompaniment of users’ writing, they were thinking of ways they could create something other than a tool for procrastination. One noticeable asset of Patatap was the sheer amount of human time spent playing with the project. Of the millions of pageviews accrued over the past two years almost 90,000 page interactions are for half an hour or more. Put conservatively that’s more than 45,000 hours. Comparatively, a Jean Paul Gaultier haute-couture dress requires about 500 hours to produce; a year of working a full time job in the United States is roughly 2,000 hours; and perhaps most famously Malcolm Gladwell coined 10,000 hours as the amount of time to master a discipline; good can come out of this cumulative focus. With this understanding they set out to imbue Typatone with more value than a procrastinatory vice.
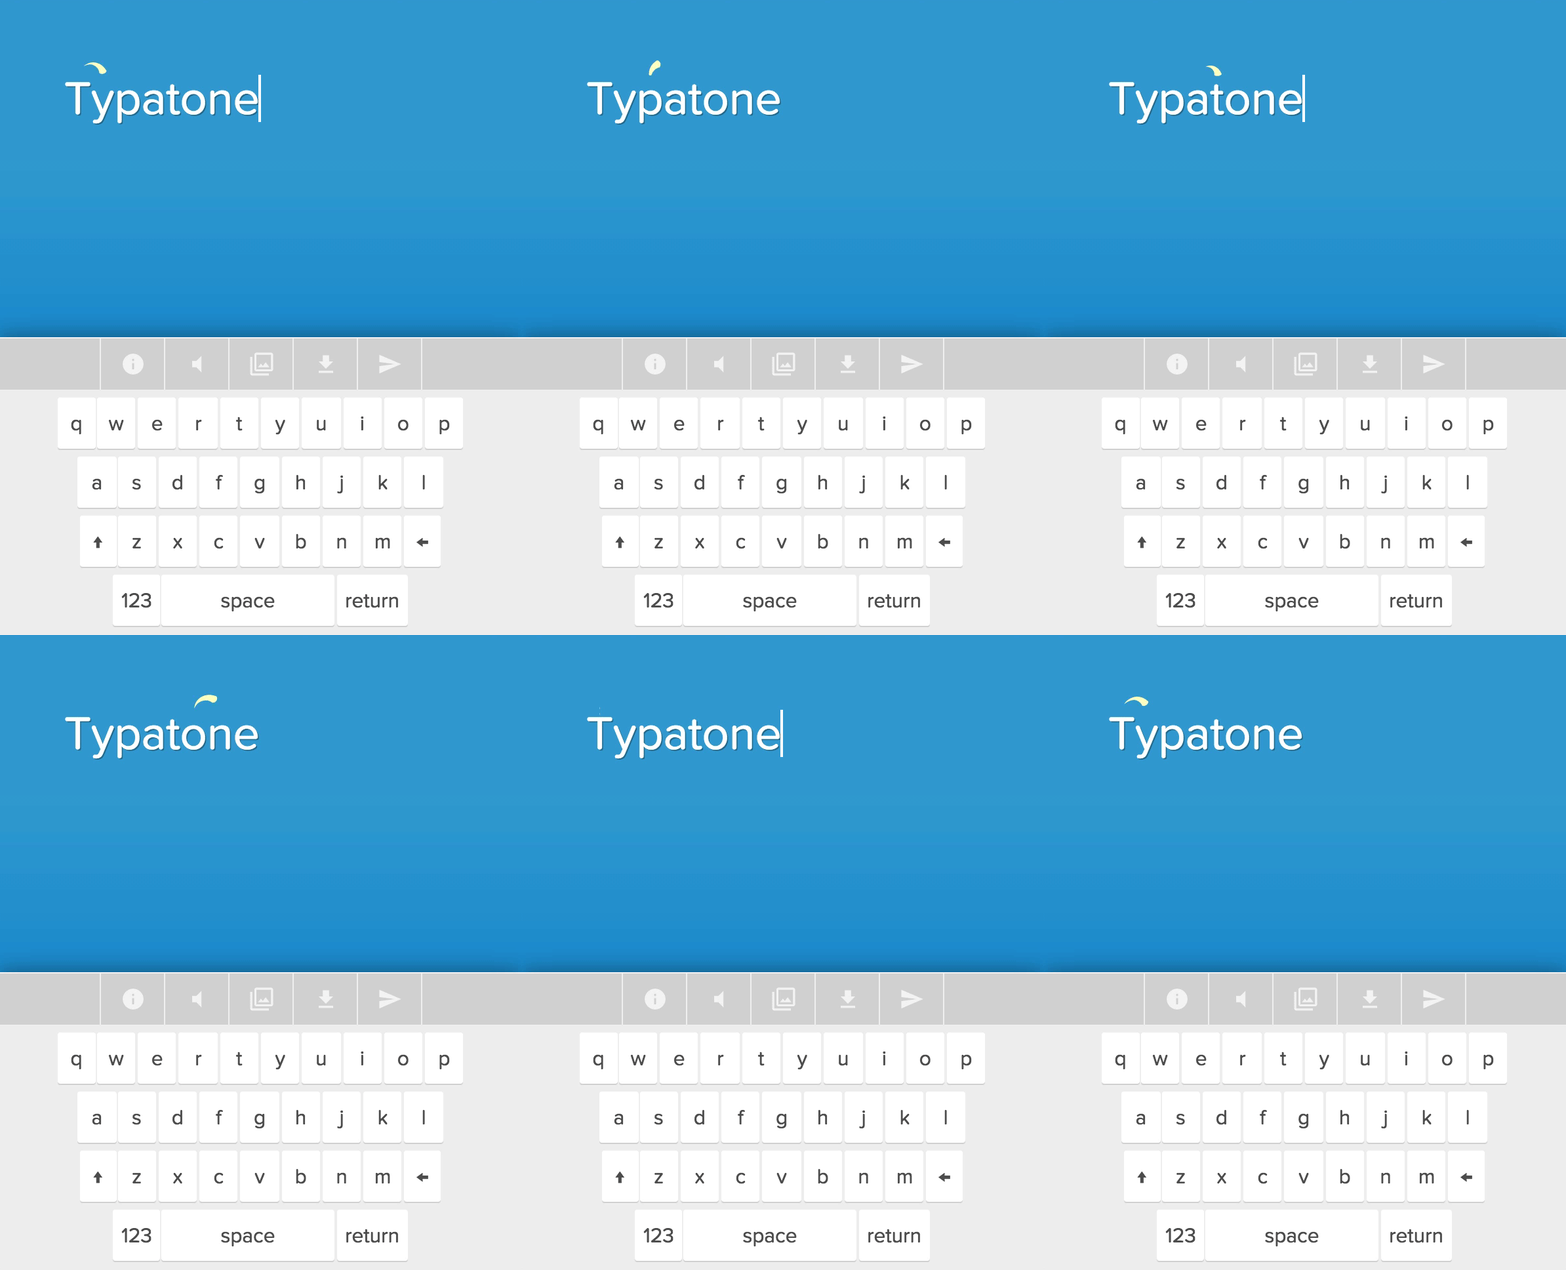
 Typatone, 2015. Animated Gif Capture.
Between 2003 and 2004 Cornell University’s Math Explorers’ Club published a series of experiments and findings under the umbrella; Number Theory and Cryptography. One such publication is the English Letter Frequency Table. Letter Frequency has many niche academic and creative uses. Lullatone and jonobr1 use Cornell’s Frequency Table in Typatone in order to come up with plausible musical notes to correlate with each typed letter. This correlation makes the project fun, inviting, and easy-to-use. After hitting 100,000 messages sent over Typatone they began doing statistical analysis to compare with the Frequency Table that was the foundation for the project. There are some expected similarities. For instance the letter “e” is the most frequent letter, however there are also some surprising differences. The letters “t” and “n” are absent from the top of Typatone’s list.
English Letter Frequency Table, 2003–2004. Screenshot. Cornell University.
As Lullatone and jonobr1 looked into the similarities and differences more, and found there are differences which make the Typatone dataset unique. First, these values are based on colloquial writing composition. A popular site, http://letterfrequency.org/, catalogs frequency of letters in many different writing styles: press reporting, religious, scientific, etc., but none are based on contemporary colloquial writing. Second, the volume of data is in order of magnitudes that are higher than what exists. The referenced Cornell Table is based on 40,000 words. Likewise, the Second Edition of the Oxford English Dictionary, which is often a source for generating letter frequency tables, has around 171,000 words. The Typatone database currently has over 1.1 million words written and continues to grow. The summation of these two aspects offers a unique and refreshing perspective on letter frequency for the academic community.
Lullatone and jonobr1 are excited to open-source and share this dataset under the MIT License.
Typatone Letter Frequency Table, 2016. Screenshot.
Access the Data
Below are the ten most recent compilations of letter frequencies analyzed across every message sent on Typatone. As a reminder this task runs on the 15th of every month with updated data. Each filename has the date it was compiled on and the version of the schema. The data is in JSON format and includes every character typed on Typatone, not just English characters. In addition there are a few pieces of contextual data to help you out. Any further questions can be fielded at inquiries@typatone.com
Everything on this page was written with care from foggy San Francisco. © 2016 jonobr1. For bibliography click all the blue links. With special thanks to Hana Cohn, Sunduck Oh, Jane Dulay, Casey Reas, and Chris Lauritzen.